1.4. Climate Analysis Part 2: Visualize Climate Data#
1.4.1. Download the visualization template#
Go to this repository and download the template.
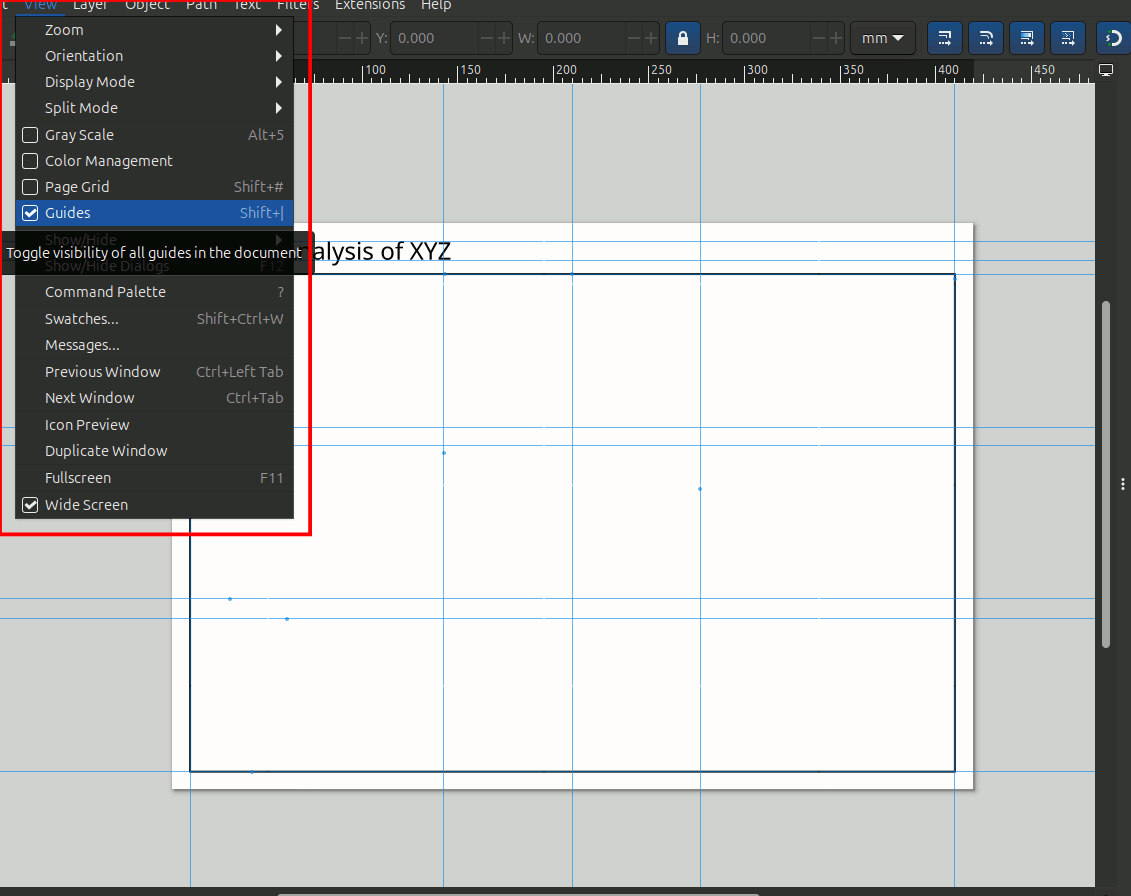
Open the .svg template file you downloaded (if you are more familiar with other vector illustration program feel free to use it (e.g. Adobe illustrator)). In inkscape, you can turn on/off the grid and guideline by going to View -> Page Grid (shift + #) and View ->
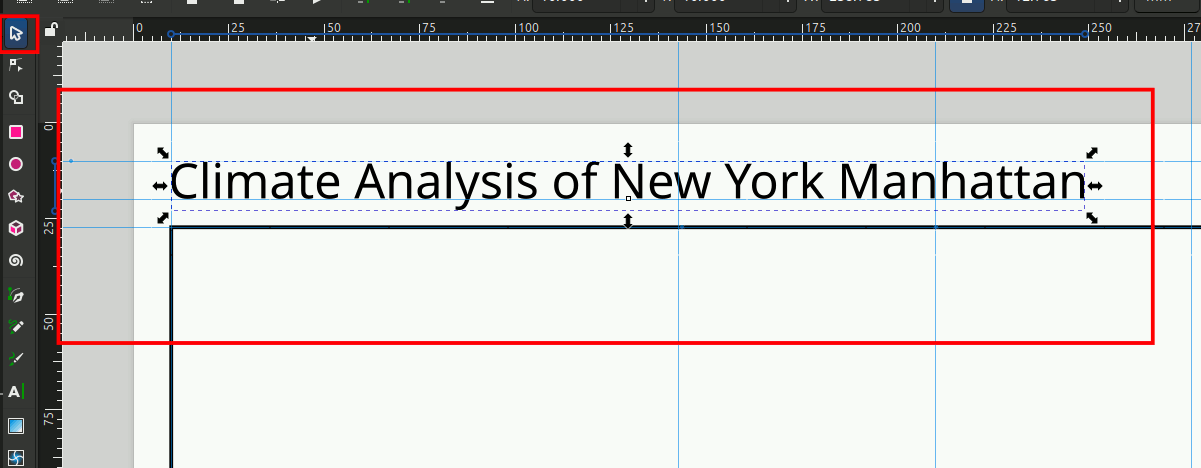
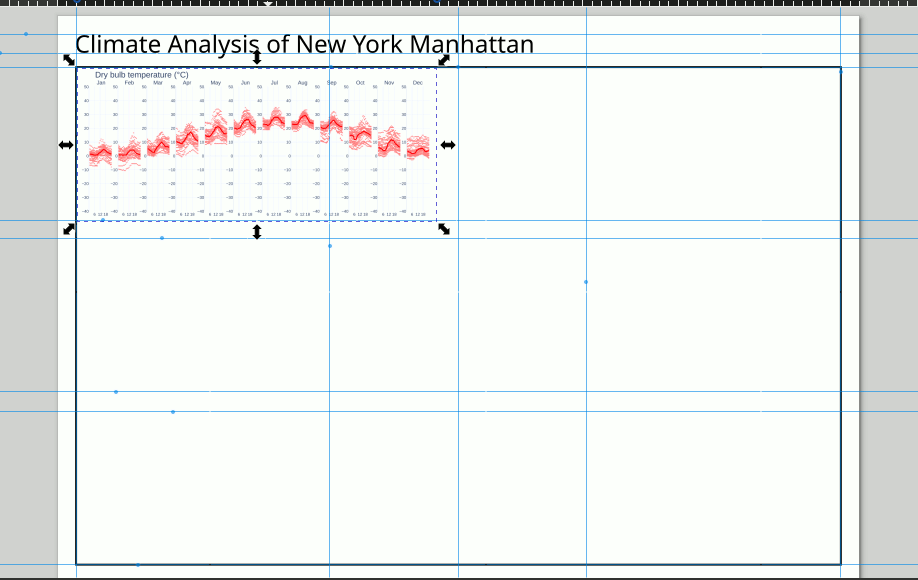
Change the title of the panel. Double click on the text and change XYZ to New York Manhattan. Once done click on the selector tool at the left toolbar, choose the text that is out of position and move it accordingly.
1.4.2. Download graphs from the CBE Clima Tool#
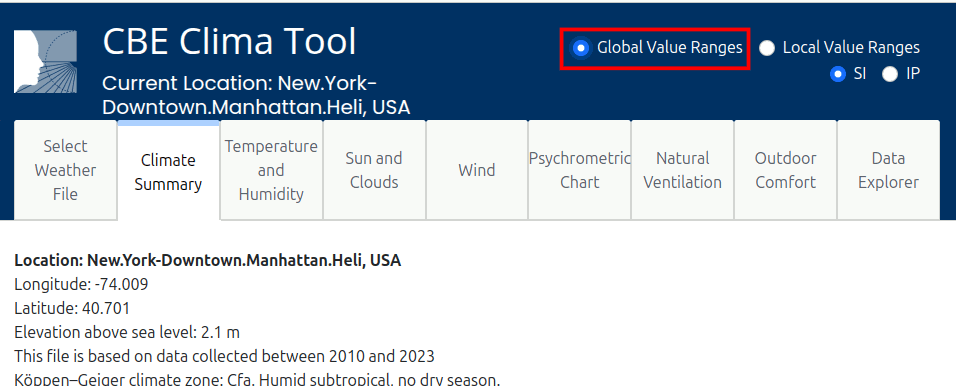
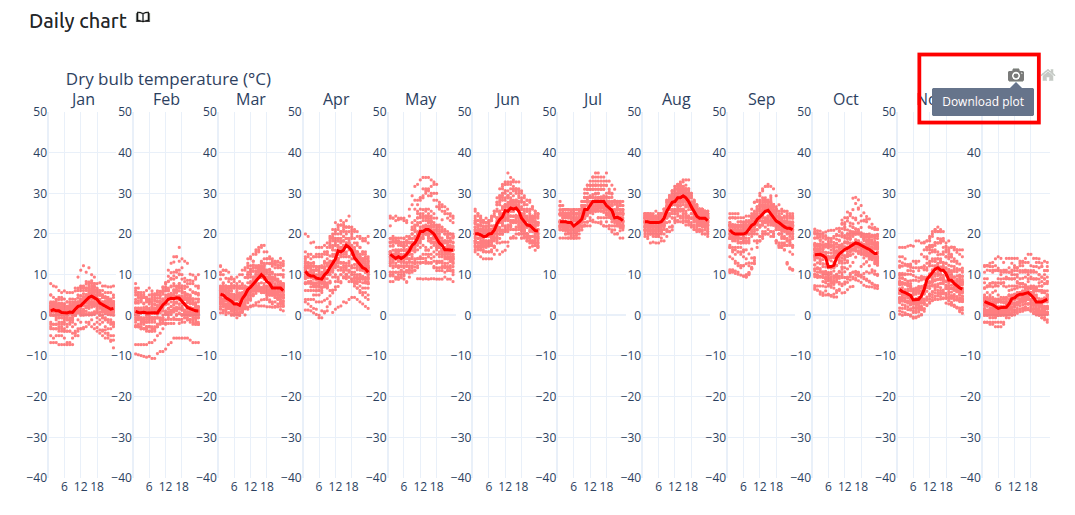
Go to the CBE clima tool. At the top right corner select ‘Global Value Ranges’. This make sure the scale of the graphs are adjusted for easy comparisons between different climates. If you are only interested in looking at a single climate with no comparison then you will choose the ‘Local Value Ranges’.
We will go to the Temperature and Humidity tab and download the Daily Chart for Dry Bulb Temperature. Hover on the graph and you will see two icons, click on the camera icon to download the graph as .svg file. Create a folder to hold all the graphs that you are going to download from the Clima tool.
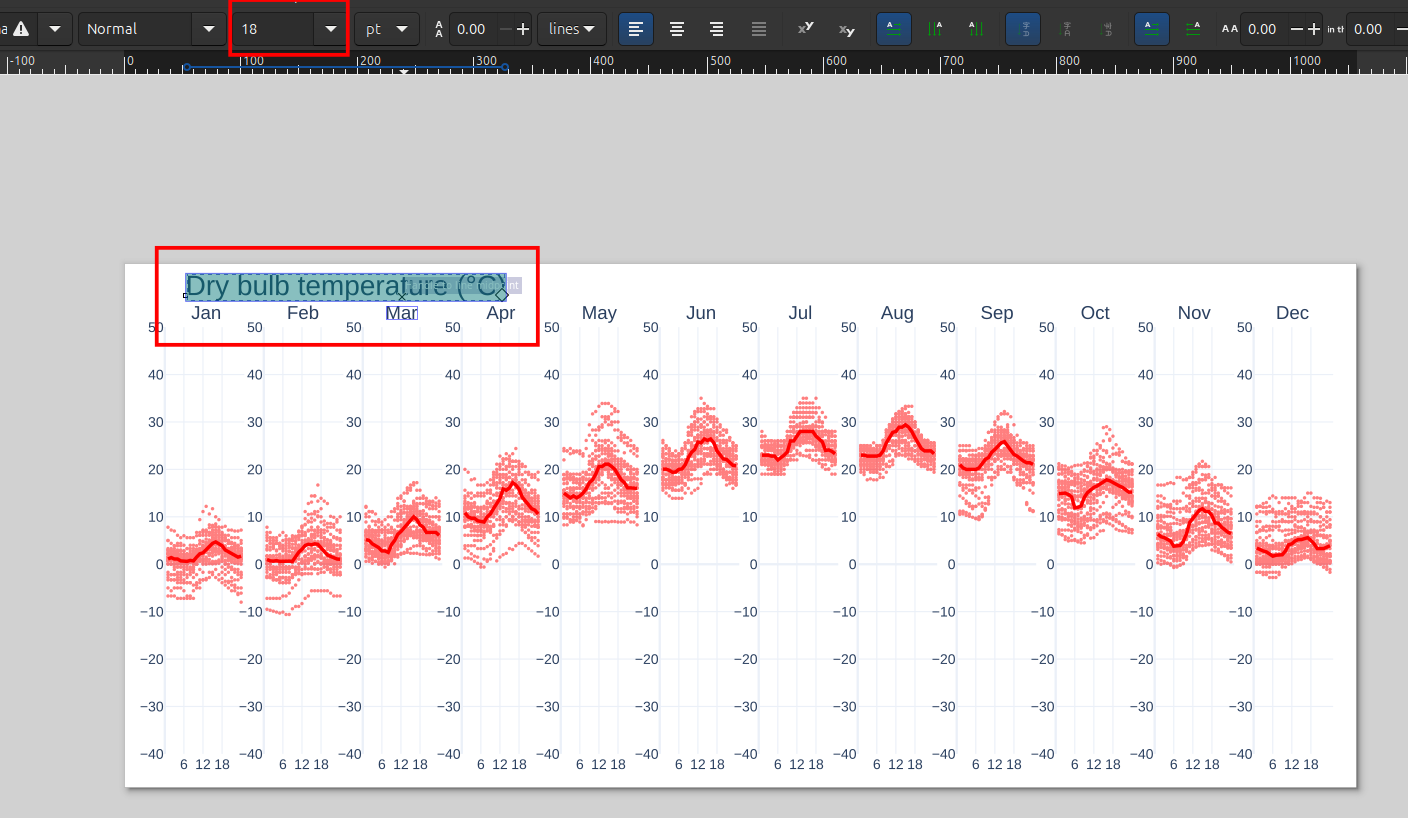
Once downloaded, open the .svg file with inkscape (if you are more familiar with other vector illustration program feel free to use it (e.g. Adobe illustrator)). You can adjust the image as accordingly. Here I will adjust the title of the graph to use a bigger font size.
double click x 3 on the title to get into the text object in inkscape.
I am changing the font size to 18 so that it is more legible.
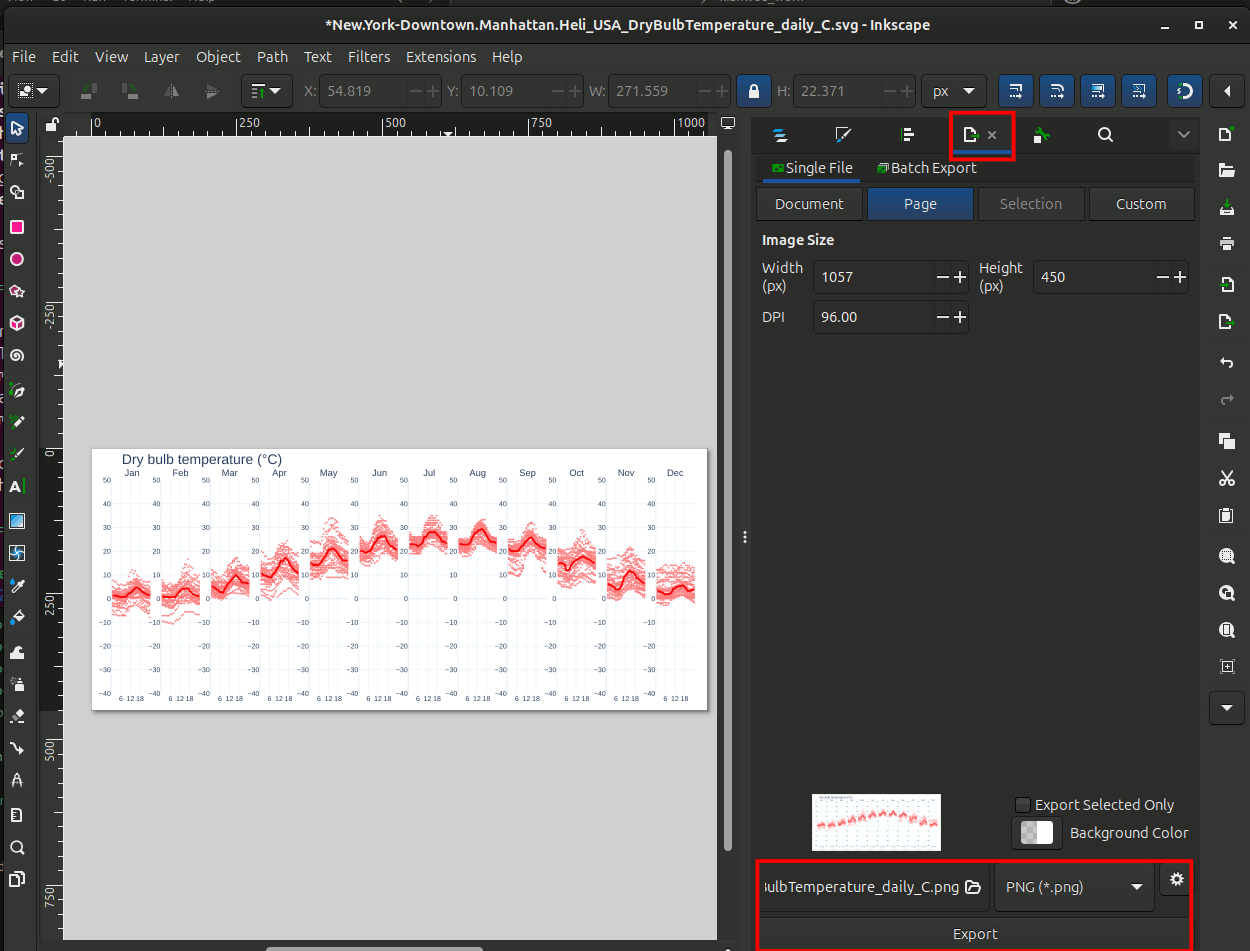
Export the image as a .png file. Export it to a folder you created in Step 2. On the right panel go to the export dialog box as shown below.
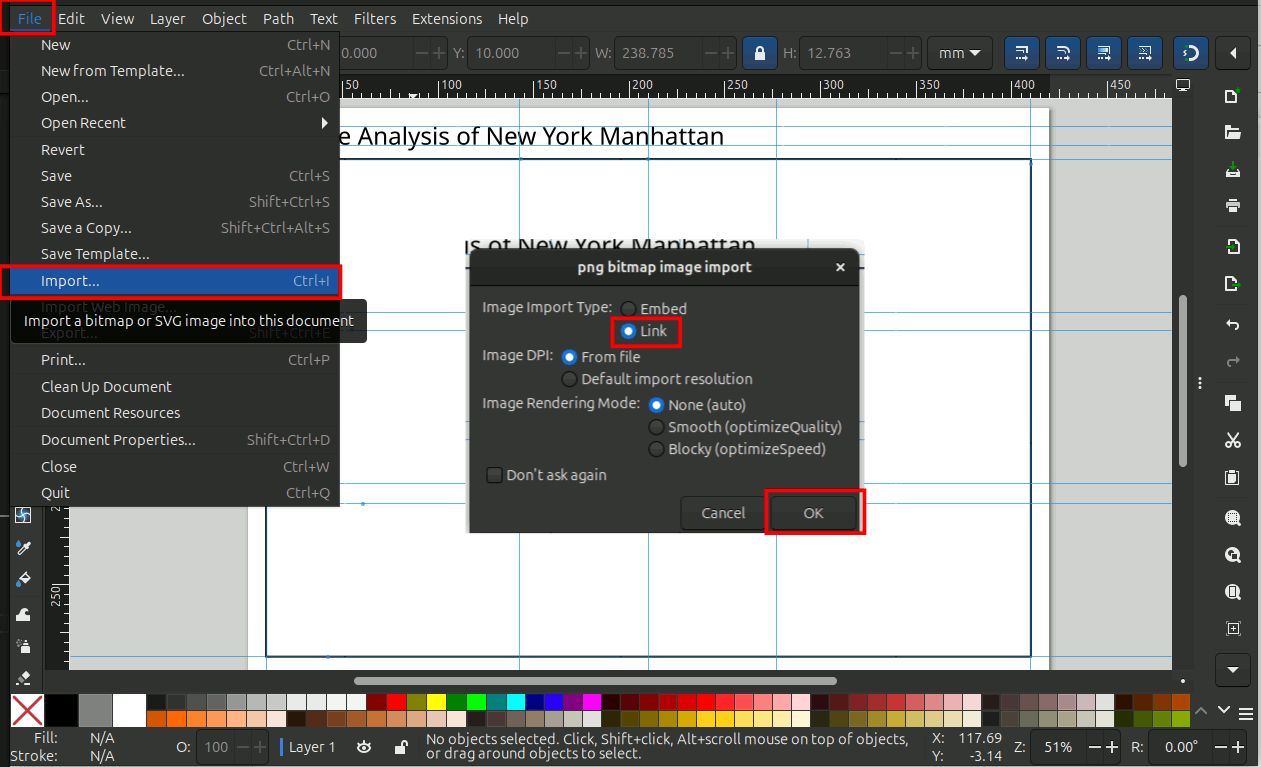
Import the png file from the previous step into the visualization template from the first section. In the import dialog choose the Image Import Type: Link. This means that if you make edits and save over the png files, it will automatically be reflected on the template. The image is not embedded onto the visualization .svg template. It also means if you move the .png image to another folder, it will break the link.
Adjust and resize the image accordingly as shown below.
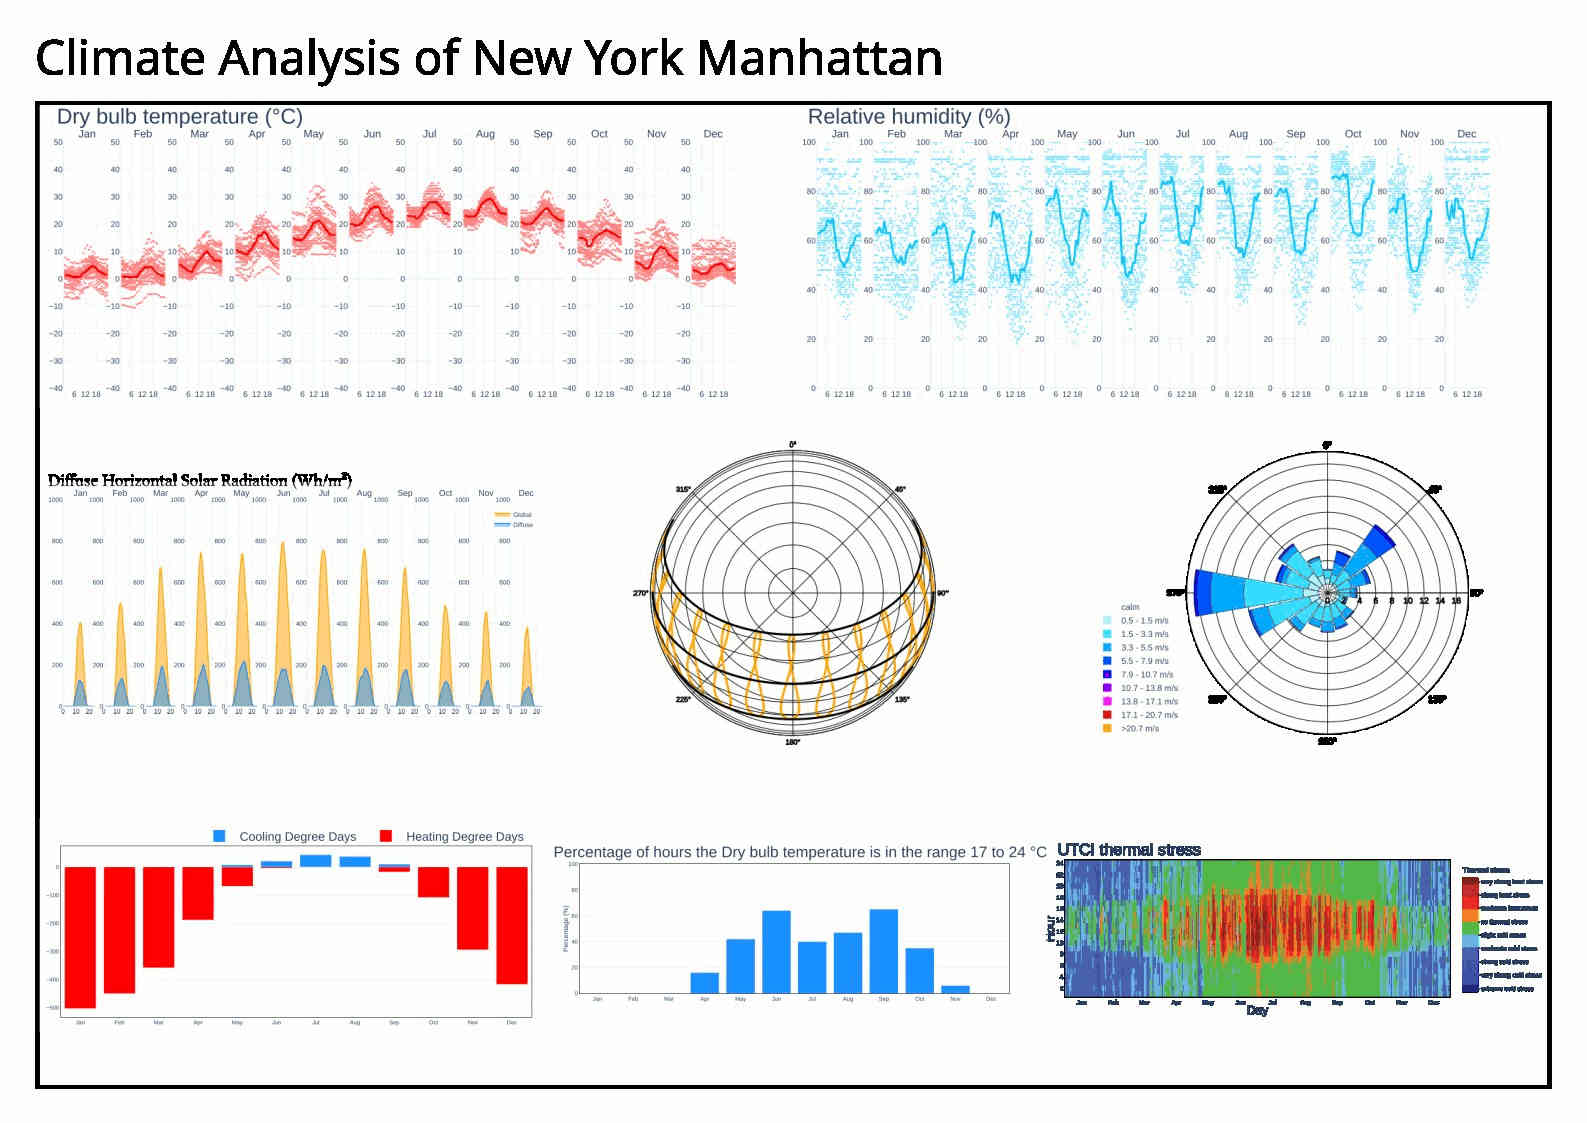
Repeat 1.4.2 Step 2-6 for the following graphs:
Climate Summary tab: Heating and Cooling Degree Days
Temperature and Humidity tab: Relative Humidity Daily Chart
Sun and Clouds tab: Sun path chart and Global and Diffuse Horizontal Solar Radiation (Wh/m2)
Wind tab: Annual Wind Rose
Natural Ventilation tab: Percentage of hours the Dry bulb temperature is in the range 17-24 degC
Outdoor Comfort tab: UTCI thermal stress chart
Your climate analysis panel should look something like this.
Do analysis for another climate and compare them. This will help you understand the climates better.