4.1. Thermal Comfort Model Part 1: Predicting Thermal Comfort#
4.1.1. CBE thermal comfort tool#
Go to the CBE thermal comfort tool.
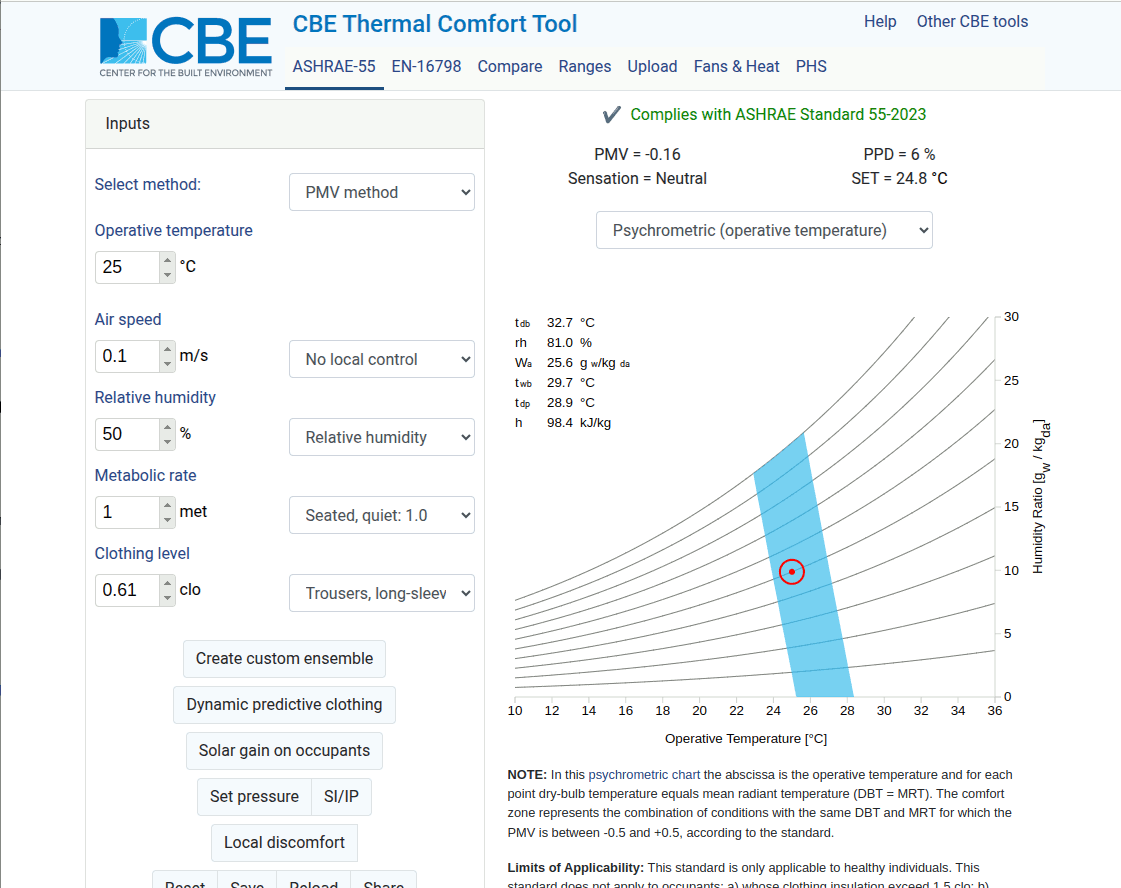
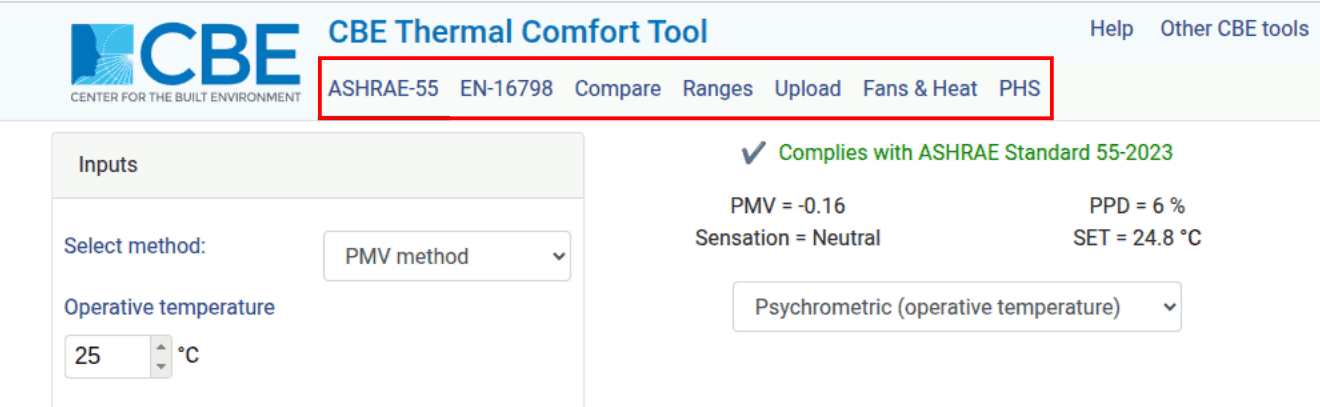
At the top bar, you have various function as described below.
ASHRAE-55: thermal comfort standard by ASHRAE (American Society of Heating Refrigerating and Air-Conditioning Engineers)
EN-16798: thermal comfort standard by CEN (Comité Européen de Normalisation (European Committee for Standardization))
Compare: allows you to key in up to 3 different conditions and compare them
Ranges: allows you to choose an input parameter and a range. It will calculate the comfort zones for the range.
Upload: upload a .csv file with a series of conditions. A batch calculation will be performed on the conditions and returned to you as .csv file.
Fans & Heat: calculate at what condiiton (air temperature + RH) is the use of fan still beneficial to cool down a person.
PHS: Predicted Heat Strain informs you on how long a person can be at that hot condition before physical damage occurs
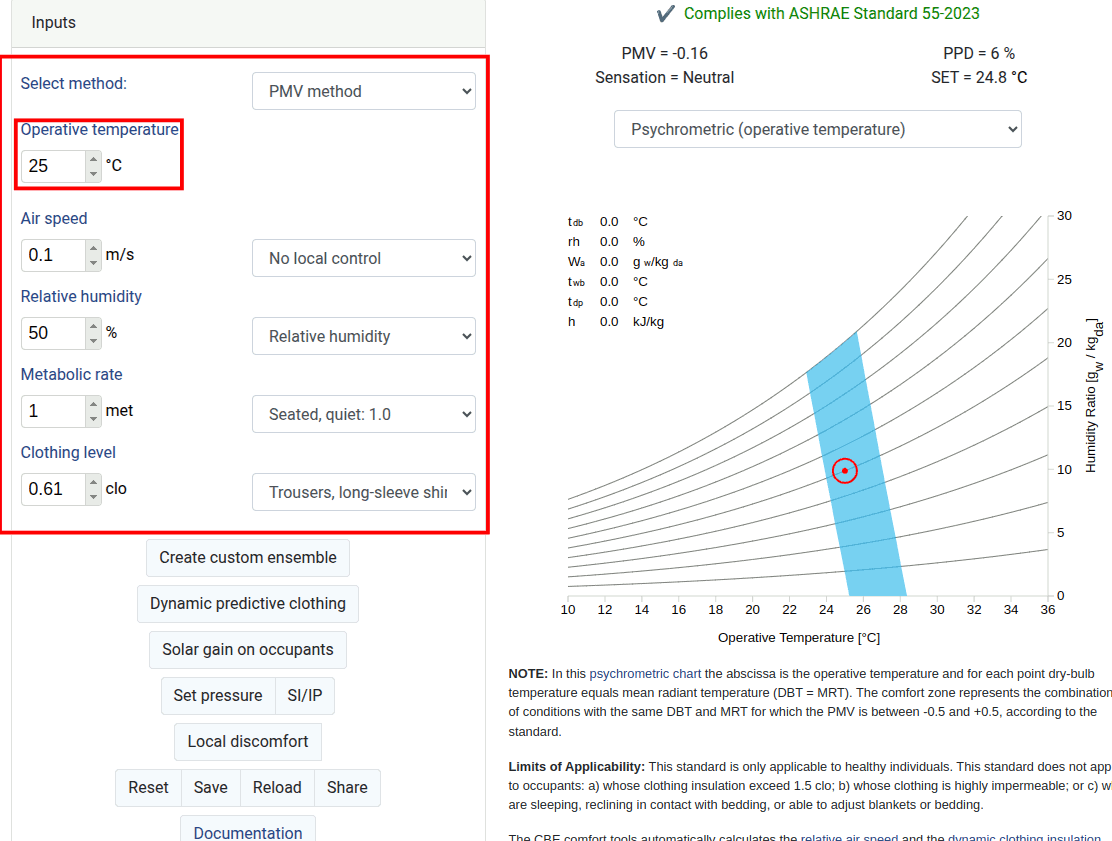
We will use the ASHRAE-55 Predicted Mean Vote (PMV) method for this tutorial. On the left bar you only see 5 factors: Operative temperature, Air speed, Relative humidity, Metabolic rate and clothing level. Air temperature and Mean Radiant Temperature (MRT) are missing and replaced by operative temperature. Operative temperature is a metric that combines both the air temperature and MRT, at its simplest form it is expressed as the average of air temperature and MRT. Read more about it on its wikipedia entry.
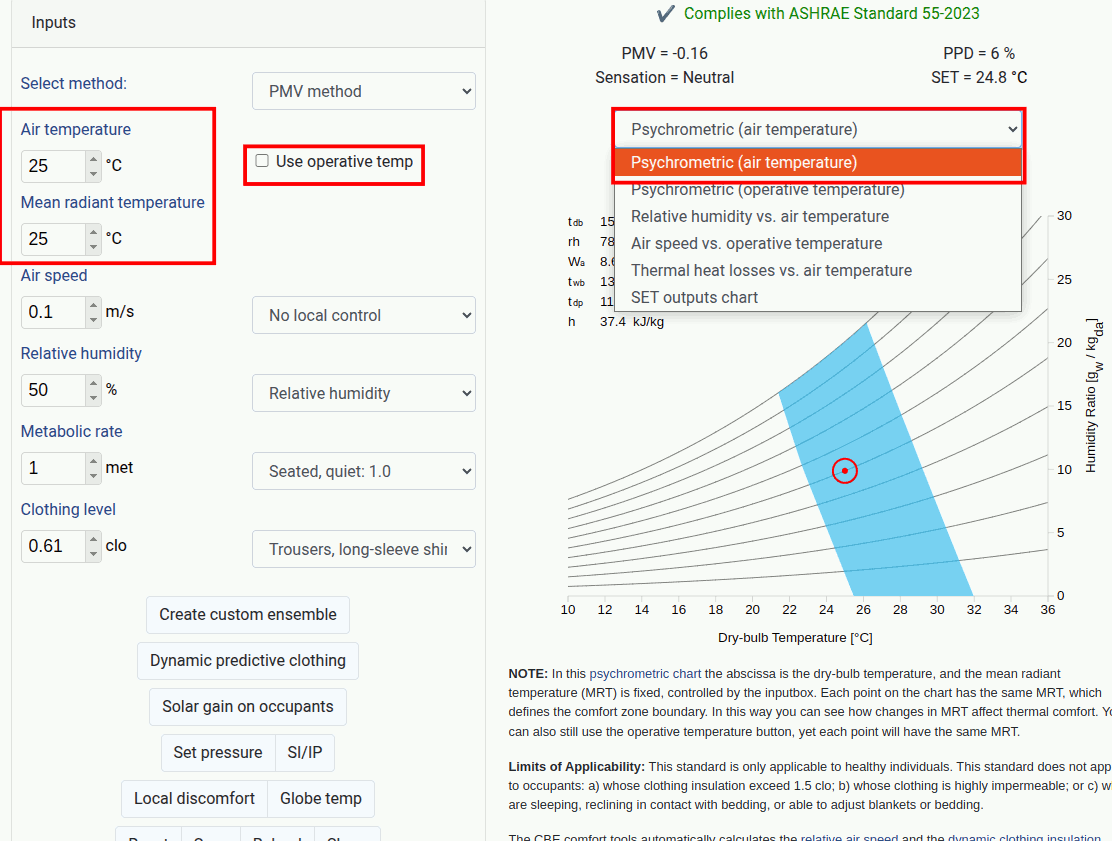
If we change the Psychrometric (operative temperature) to Psychrometric (air temperature) and untick the Use operative temperature we can separate operative temperature into Air temperature and Mean radiant temperature.
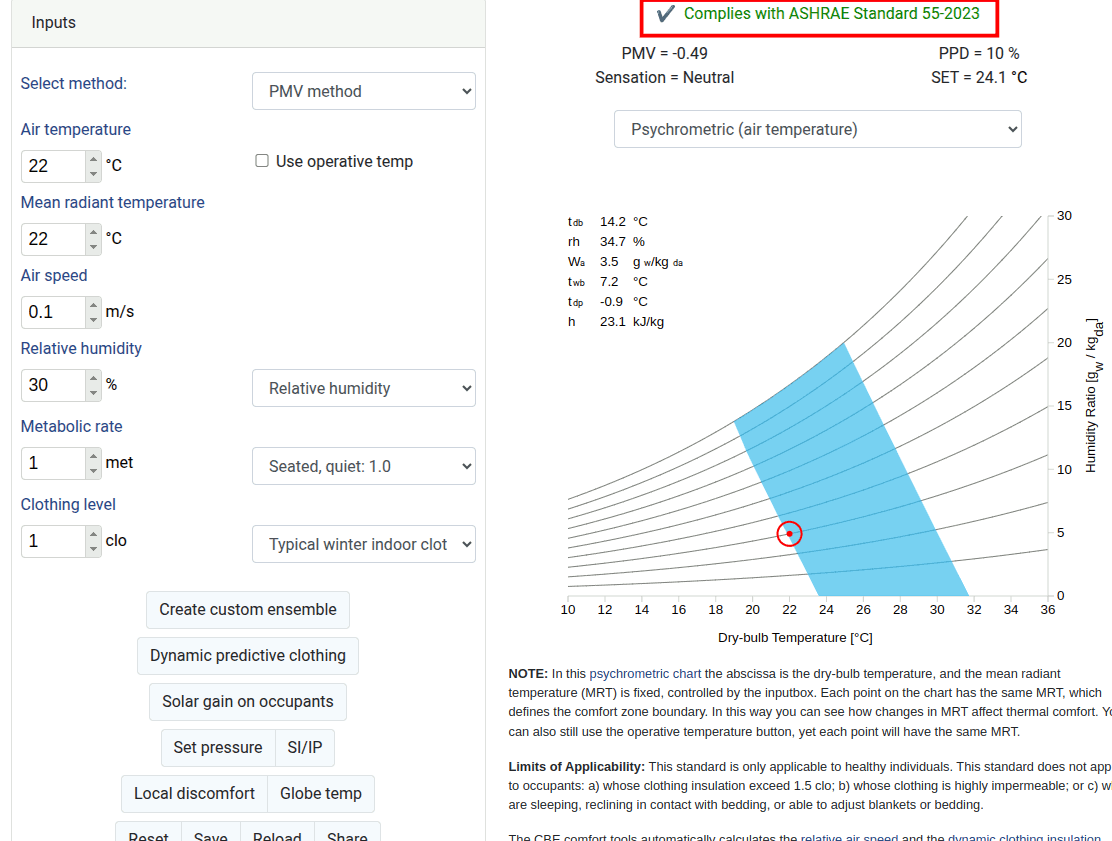
Key in the following values for a winter scenario:
Air temperature = 22 degC
Mean radiant temperature = 22 degC
Air speed = 0.1 m/s
Relative humidity = 30%
Metabolic rate = 1 met, seated quiet
Clothing level = 1, Typical winter indoor clothing
It complies with the ASHRAE Standard 55. For winter, based on the model an air temperature of 22 degC (71.6 degF) setpoint shld be sufficient to keep a person comfortable, if the other conditions as specified are met. The PMV vote is -0.49 (0 being neutral not hot and not cold) with Percentage of People Dissatisfied (PPD) = 10% that means 10% of the people in the room might be unsatisfied with the thermal condition.
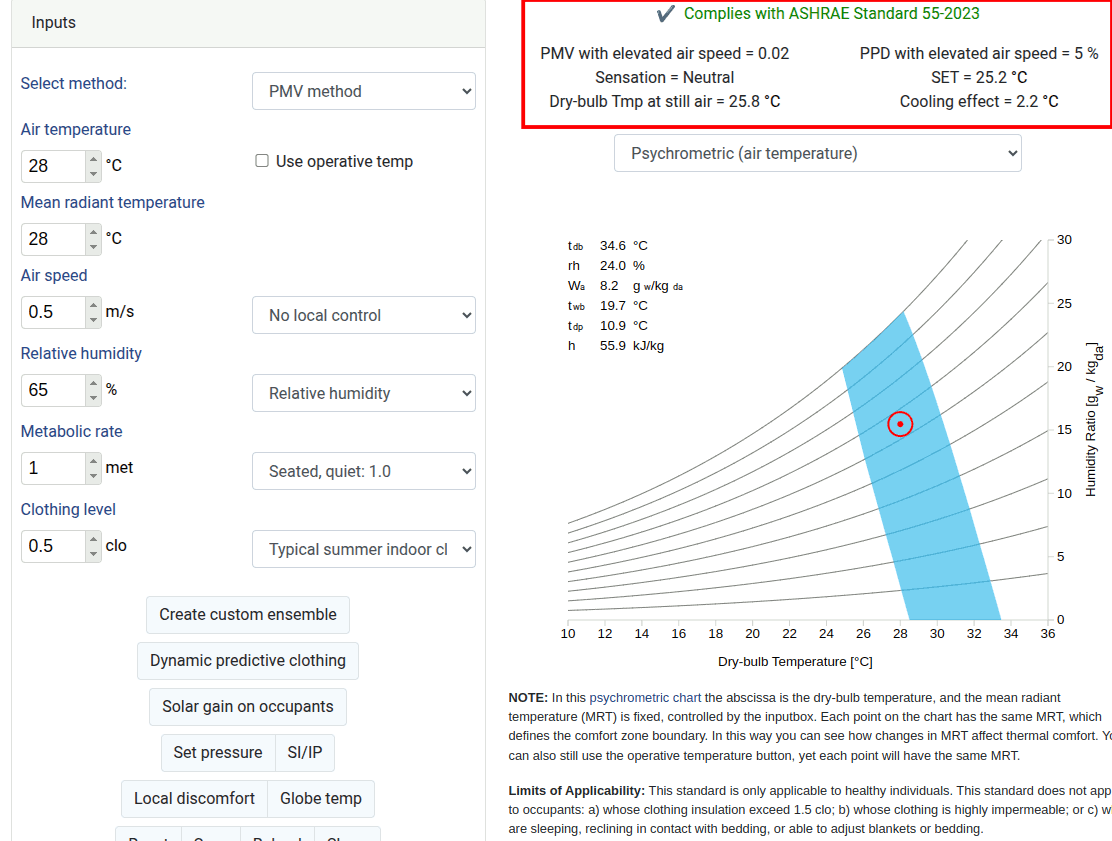
Key in the following values for a summer scenario:
Air temperature = 28 degC
Mean radiant temperature = 28 degC
Air speed = 0.5 m/s (this is assuming we have a fan in the space)
Relative humidity = 65%
Metabolic rate = 1 met, seated quiet
Clothing level = 0.5, Typical summer indoor clothing
It complies with the ASHRAE Standard 55. For summer, based on the model an air temperature of 28 degC (82.4 degF) setpoint shld be sufficient to keep a person comfortable, if the other conditions as specified are met. The PMV vote is 0.02 with Percentage of People Dissatisfied (PPD) = 5%.
4.1.2. Changing the set point in OpenStudio#
In this section we will be using the shoebox model that was constructed in the previous exercise.
Run a simulation with the original cooling (25 degC) and heating (24 degC) setpoint schedule.
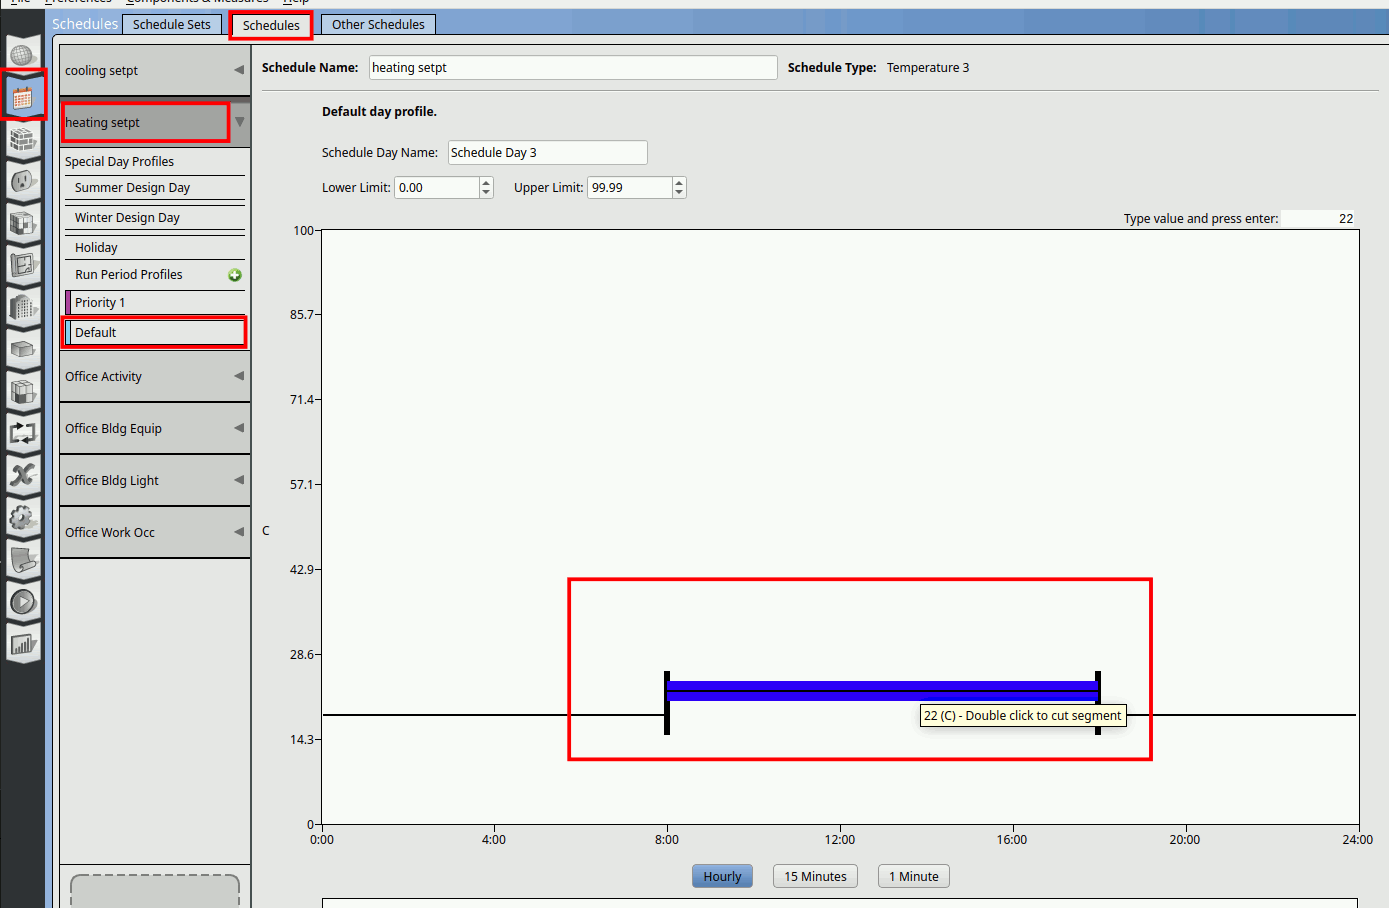
From the thermal comfort model. A heating setpoint of 22degC and cooling setpoint of 28degC are sufficient for thermal comfort. Let’s edit the set point schedules accordingly. Open the shoebox.osm model and go to the schedules. Select the cooling setpoint and Default schedule. Change teh set point to 28 degC as shown in the image below.
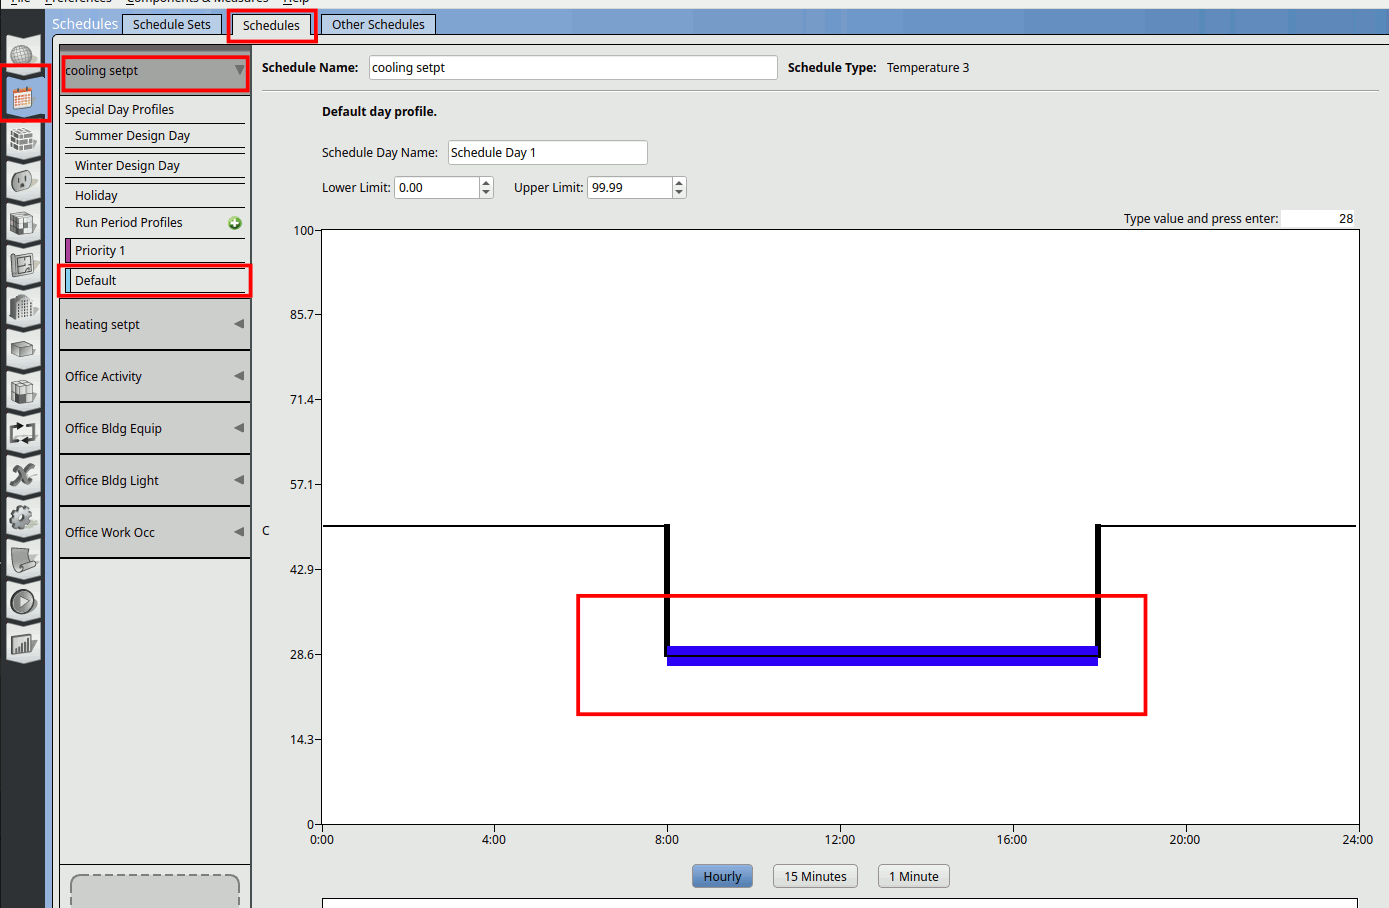
Do the same for the heating setpoint schedule.
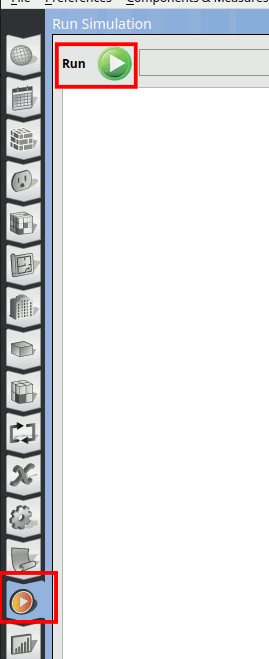
Run the simulation.
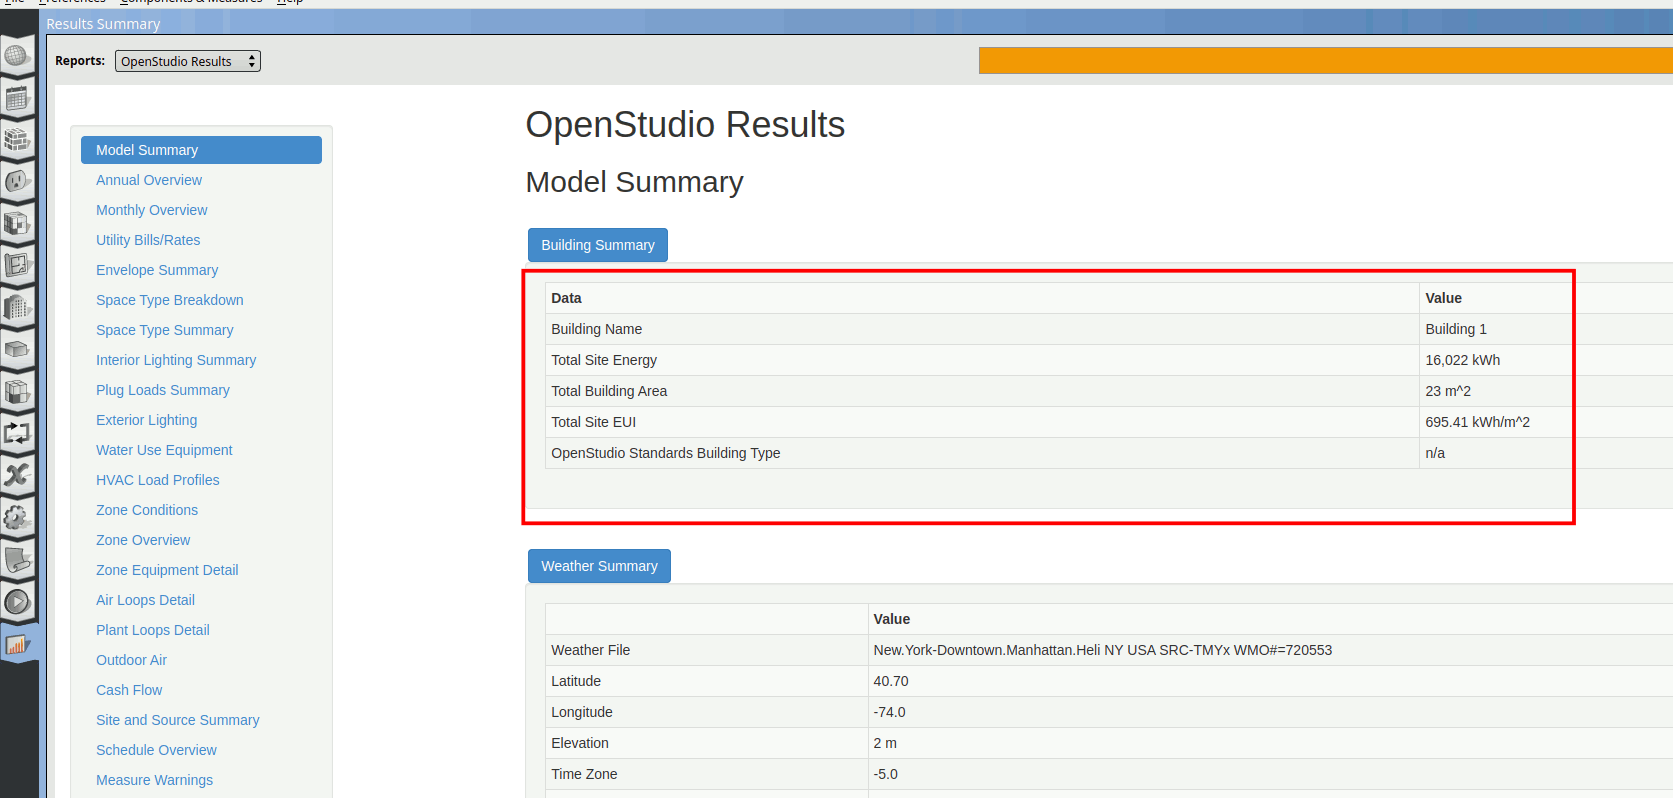
We can see the EUI significantly reduced by almost 11%.
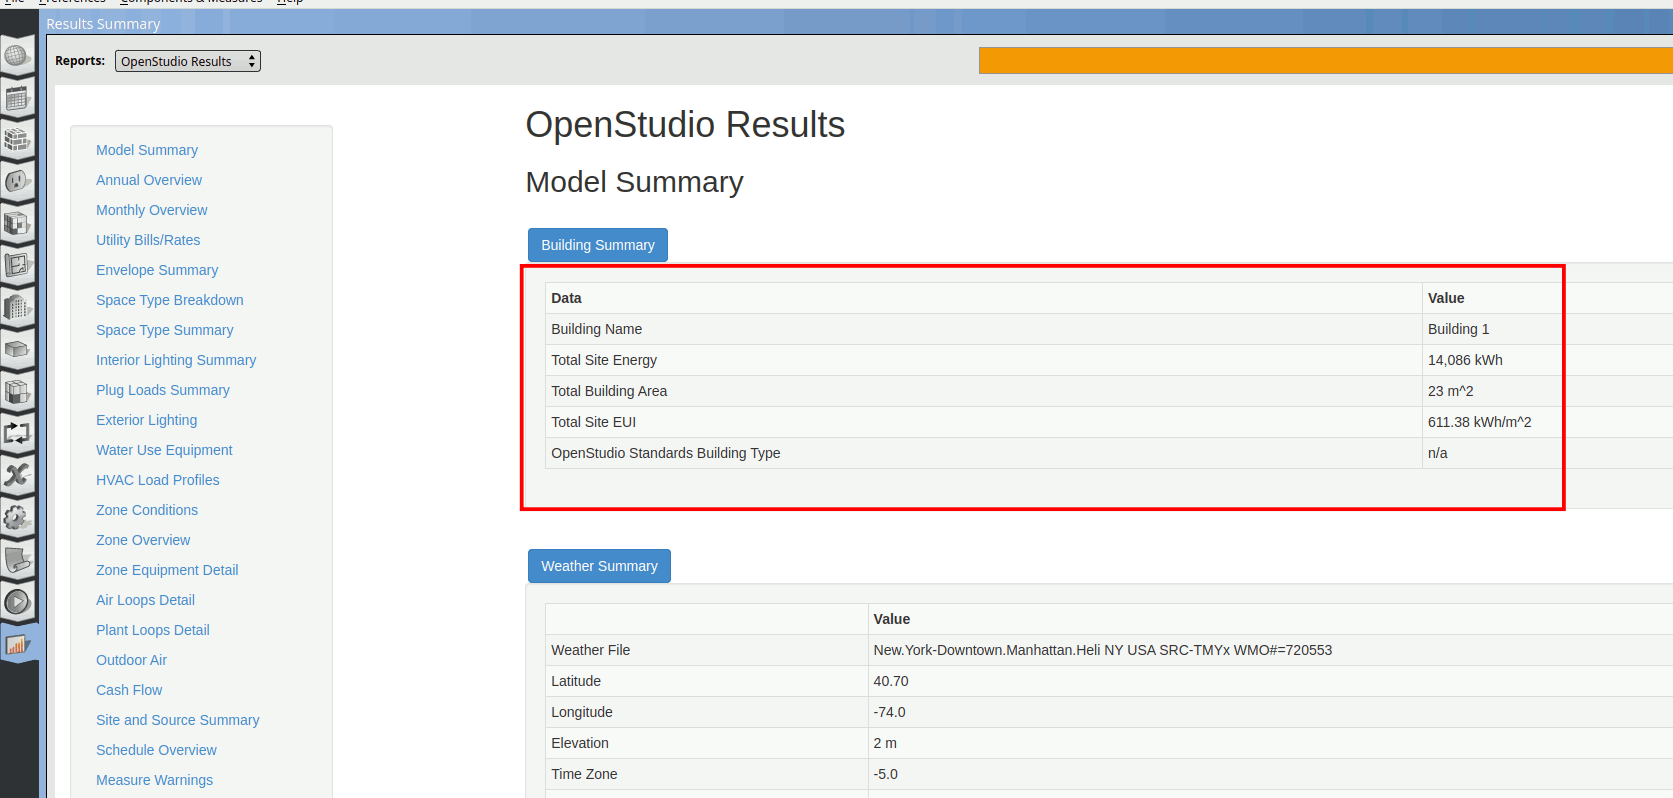
Next lets look at how to present the results.