3.2. Gather all the map onto a canvas#
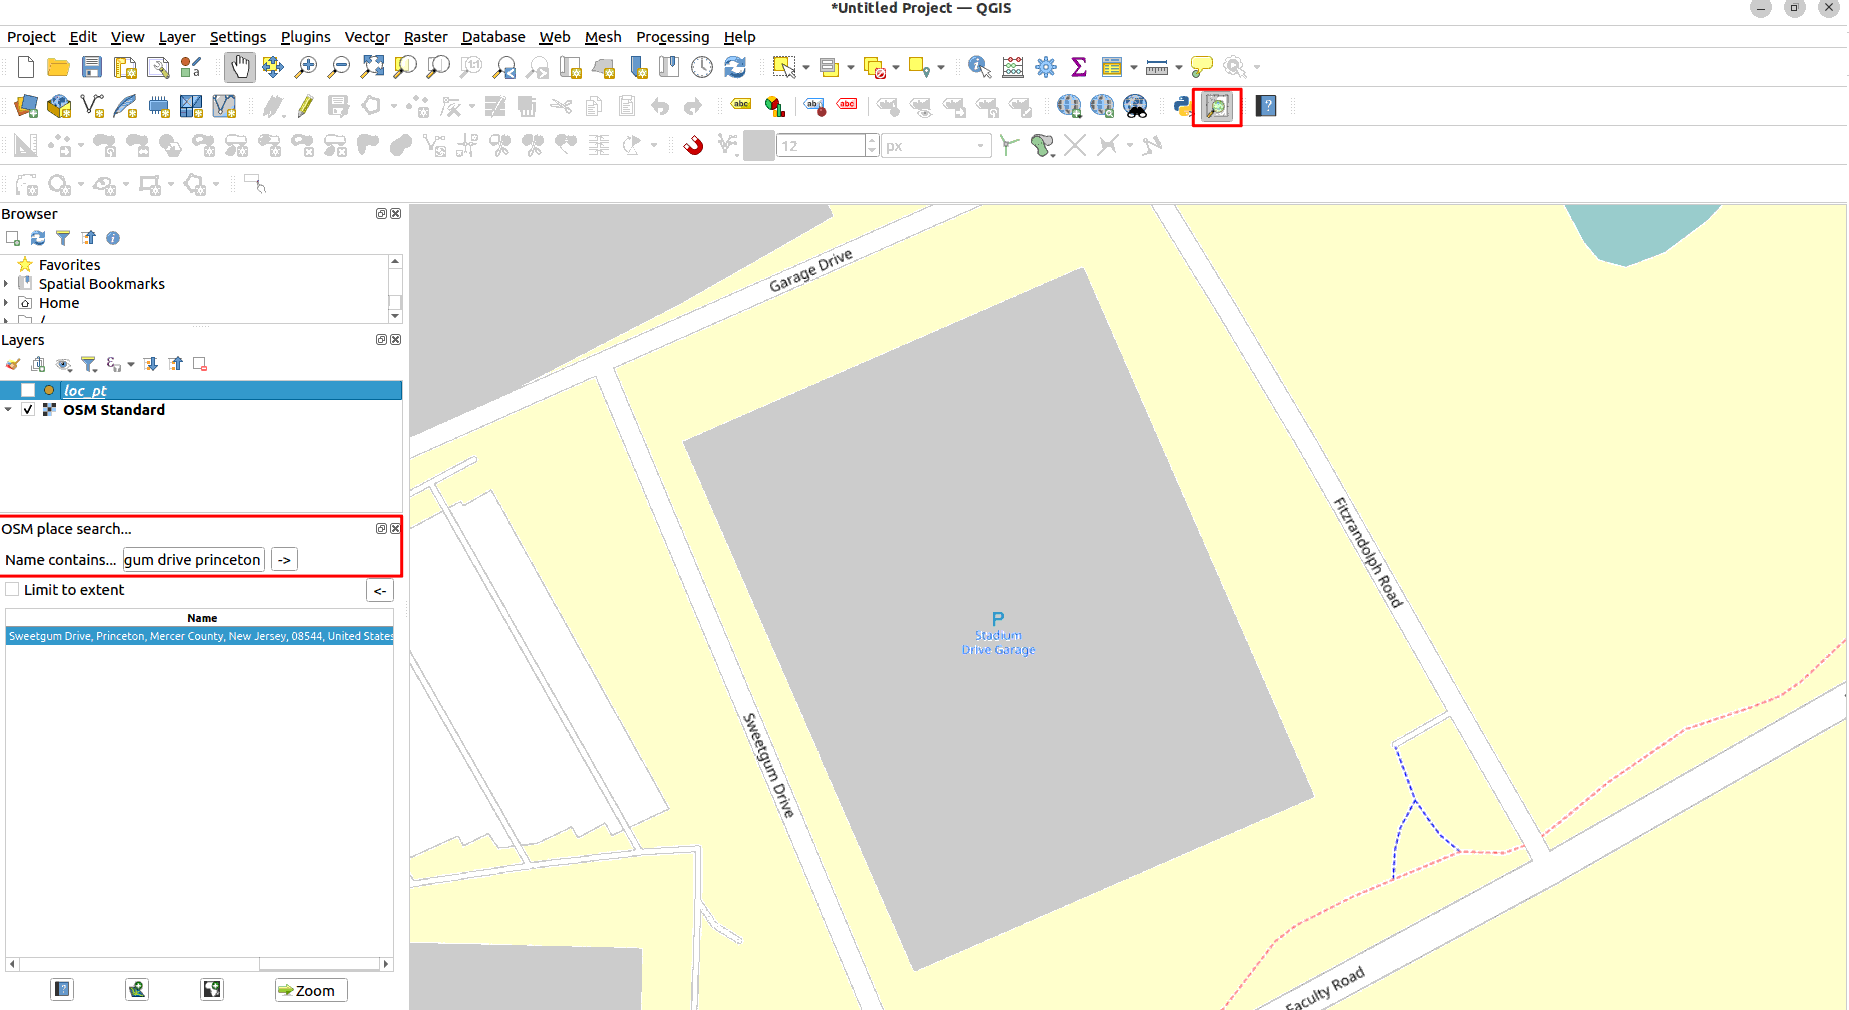
We are particularly interested in the Stadium Garage waiting area. So search for “sweetgum drive princeton” on the OSM place search.
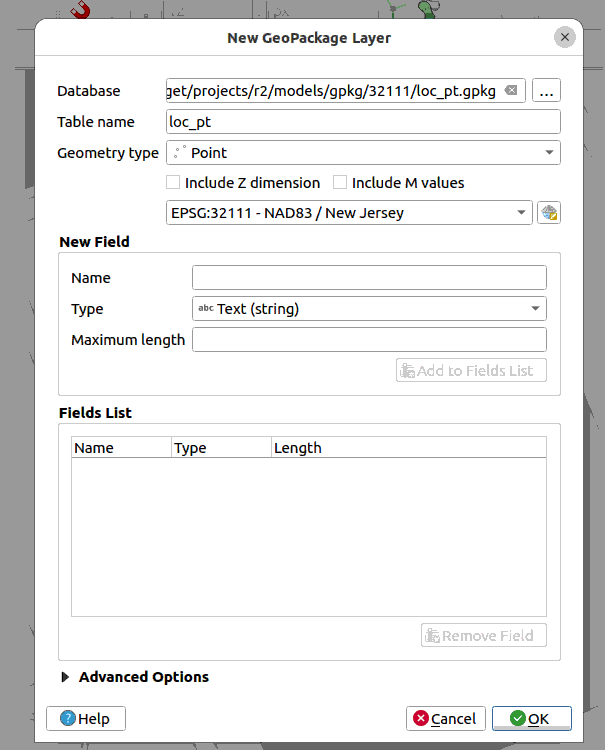
Draw a location point on the garage footprint as the reference point for our future operation. Go to Layer -> Create Layer -> New GeoPackage Layer. In the window fill in the parameters as shown below.
We will be using the Projected CRS: EPSG:32111. The units is in meters. If you are more used to using feet, use EPSG: 3424. Click here for more information on CRS
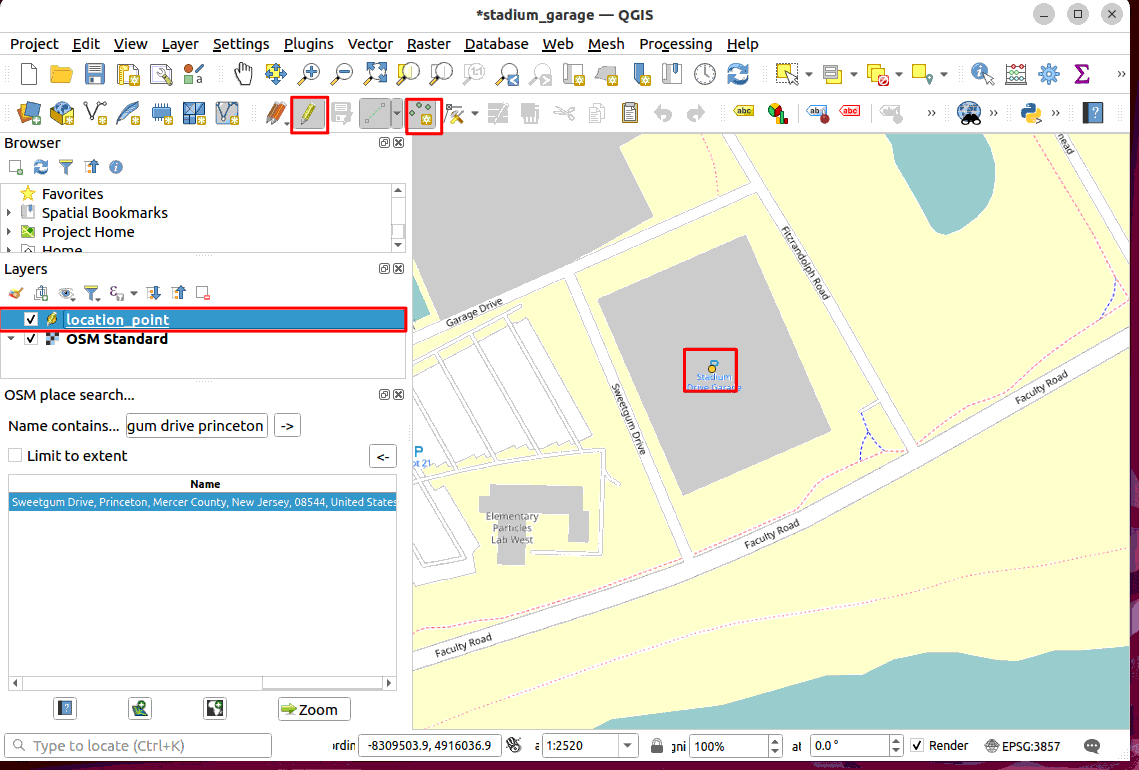
Draw the point by selecting the layer. Turn on the “Toggle Edit” icon, and “Add Point Feature”. Draw the point on the footprint.
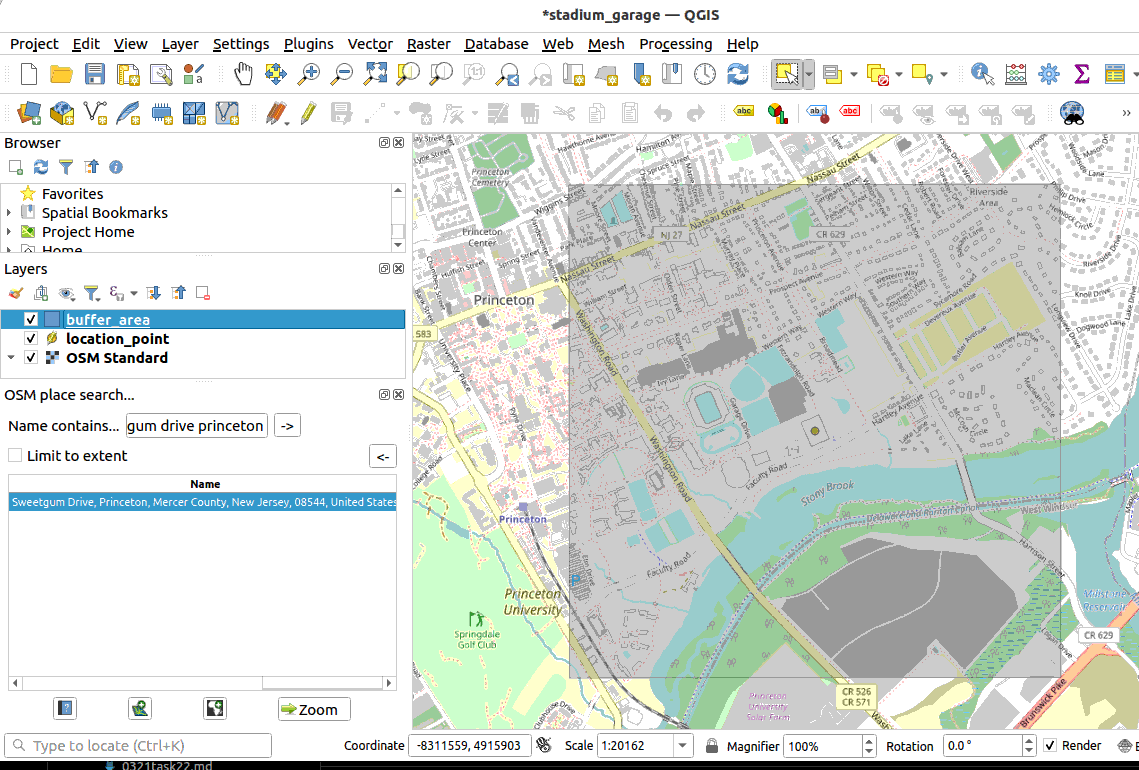
Define the radius of interest from this point (Draw a Circle/Square with Buffer), 3KM. Adjust the transparency of the layer (Change the Colour and Opacity of a Polygon Feature Layer). Save the layer as a .gpkg file and remove the temporary layer.
Grab data from OSM (OSM-related Plugins and Functions). Remember to convert the multiparts layer to single parts. You can merge all the path layers together into one. Then save all the layers converting their Projected CRS to EPSG 32111.
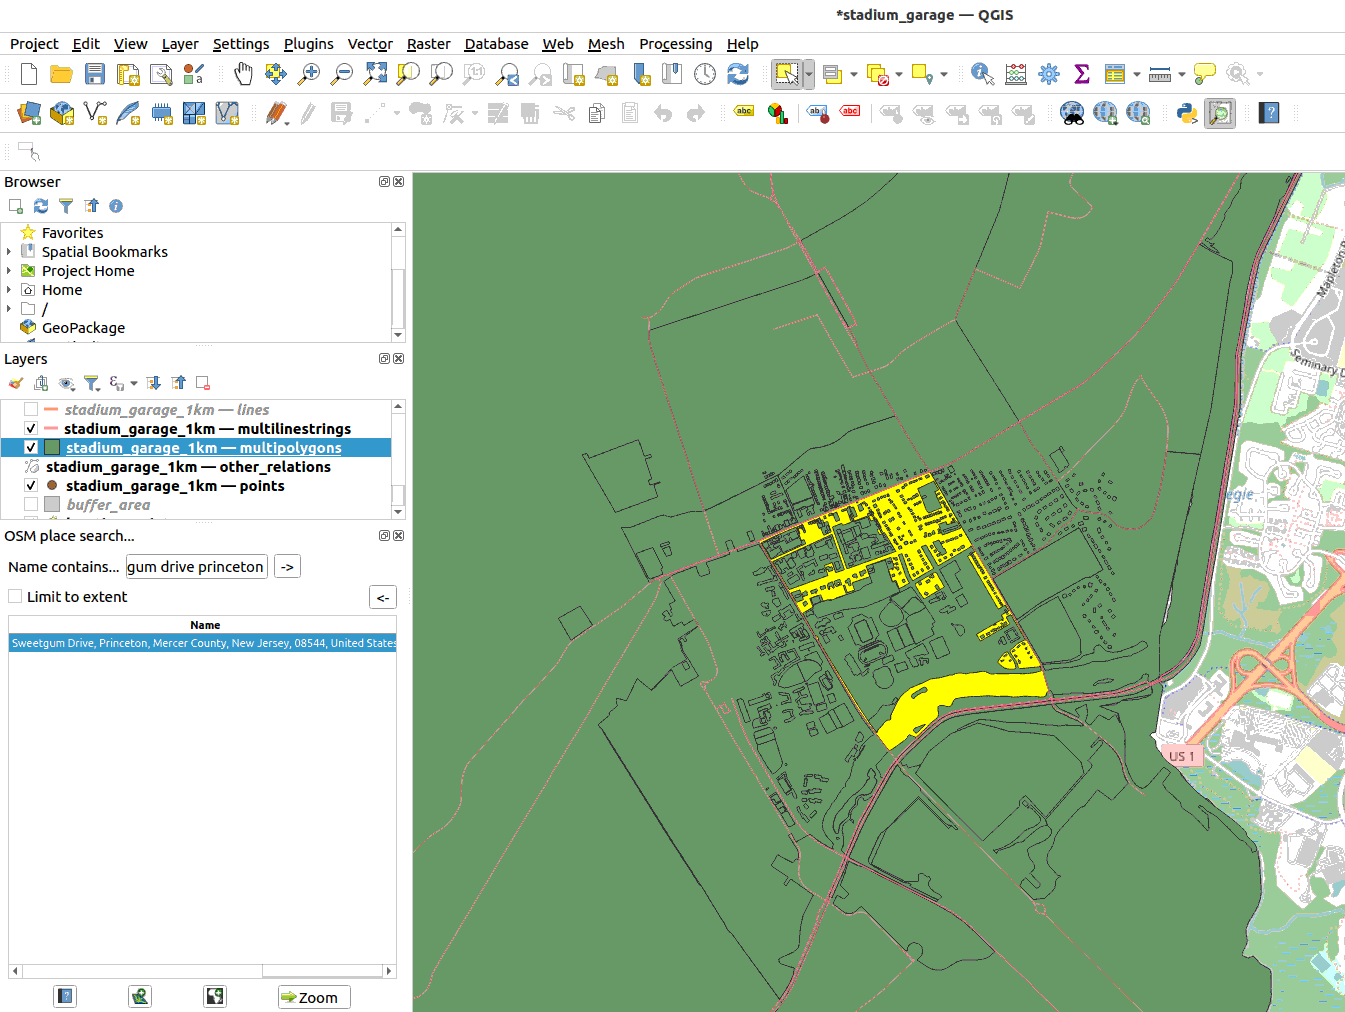
Get all the building footprint from the osm data. After you convert the multi-polygon layer to single layer. Do the following filter to filter away all the non-buildings.
"building" IS NOT NULL
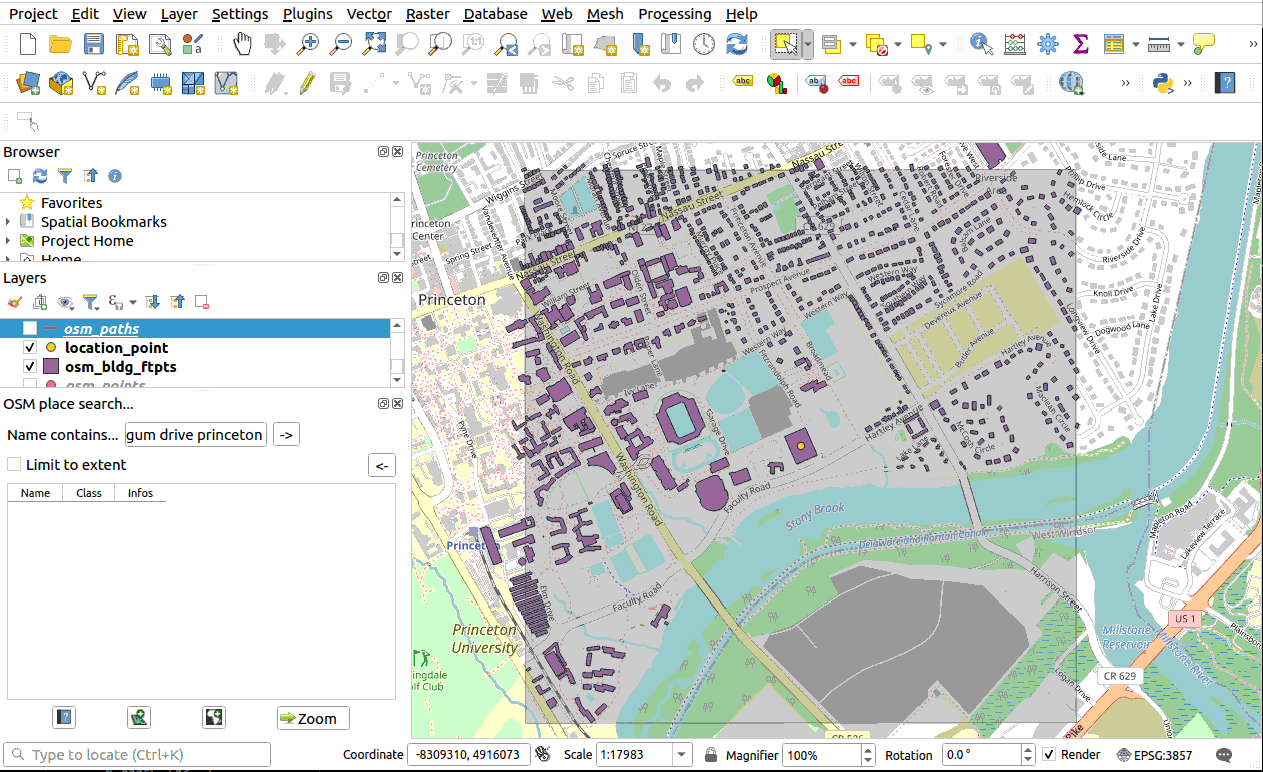
Also get the building footprint from the Microsoft Building Footprint Project . Follow the instructions here to get building footprint of your interest. Use the following parameters to extract buildings for Princeton. Then add the geojson into the canvas. Save the layer as geopackage as geojson has slow performance. The building footprint dataset from Microsoft includes building height, which makes building a 3d massing model of the site very handy.
location = 'UnitedStates'
lat = 40.345680487096764
lng = -74.65880323282136
Download the New Jersey DEM data (New Jersey Geographic Information Network). It is a huge dataset make sure you at least have 30gb of storage.
Once imported into QGIS, clip it with the buffer area. You can do this by right clicking on the layer -> export -> Save As … In the dialog box clip the area with the “buffer_area” layer.

Get the impervious surface data of mercer and middlesex county (where Princeton University is located). Search for “Mercer County Impervious Surface” and download the .gdb file. Instructions here.
Download the parcel information of New Jersey MOD-IV. Instructions here.
Get the road networks of New Jersey. Instructions here.
Get all the features within an area. You can then clip the layers when necessary. So you are only dealing with the information you need.
Get the 3D Las files (point clouds) of the area using the map tile interface.
load the point cloud files onto qgis Layer -> Add Layer -> Add Point Cloud Layer. To make sure you got the right tiles, superimpose the data onto the map and see if they overlaps with the area of interest. Save and reproject the layer to the right CRS.
You can add more information layer onto the canvas as required for your project. With these layers one can already do many analysis.